Survey and infographic: L&D Trends on Twitter in 2017/Q1

2016 witnessed a dramatic rise in the popularity of Virtual Reality and Artificial Intelligence. There were also a couple of surprising findings, more on which is available in L&D Trends on Twitter in 2016.
Analysing and reporting on data is an essential part of the JollyDeck DNA. So we’ve decided to make a regular thing of it. Presenting: the 2017 Q1 L&D Twitter Trends Update.

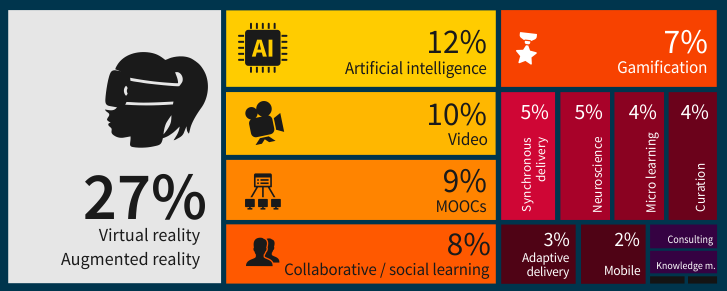
According to our Q1 Twitter data, Virtual Reality, with Augmented Reality, are the topics continuing to dominate the Twitter sphere. Artificial Intelligence climbed to second place during the last three months. Video, Moocs and Social Learning are nearly as important, while other topics received less attention.
Polarisation is clear. While top trending topics are steadily gaining ground, topics from the bottom of the list are lagging ever further behind. Who said L&D can’t be trendy?
There’s also a perception bias at play. Taylor’s survey and our subsequent research show a clear mismatch between what are actually the hottest themes on Twitter, and the predictions.
The top 4 most popular topics on Twitter were completely ignored in the predictions published only 3 months ago.
You can see in the charts that the growth of VR/AR probably plateaued at the end of last year and hasn’t seen much change since. The US remains significantly more excited by this technology than the UK.
AI appeared virtually out of nowhere in the beginning of 2016 and has been steadily gaining traction over the last 15 months. AI is equally popular on both sides of the Atlantic.
With Facebook killing off it’s Oculus Story Studio (the in-house VR highlight reel), it’s becoming clear that while VR is garnering a lot of attention, it’s still a few good years away from widespread adoption. And we’re not too sure it will even happen. Our bets are on AR more than VR. AI is also showing remarkable advances, but has not as of yet gained trust from the wider L&D community.
Here’s a list of overall results in 2017/Q1:
| Keyword | Results |
|---|---|
| Virtual / Augmented reality | 26.78% |
| Artificial intelligence | 12.21% |
| Video | 9.66% |
| Collaborative / Social learning | 8.95% |
| MOOCs | 8.86% |
| Games / Gamification | 7.40% |
| Synchronous delivery / Webinars | 6.30% |
| Neuroscience / Cognitive science | 4.47% |
| Micro learning | 4.42% |
| Curation | 3.54% |
| Personalization, adaprive delivery | 2.95% |
| Mobile delivery | 2.13% |
| Consulting more deeply with the business | 1.90% |
| Knowledge management | 0.99% |
| Earable tect | 0.19% |
| Personal knowledge mastery | 0.09% |
Data sources
For the purpose of our survey we analysed tweets by the following influential Twitter profiles:
- Donald H. Taylor (@DonaldHTaylor): 10,569 followers
- David Kelly (@LnDDave): 12,828 followers
- Towards Maturity (@TowardsMaturity): 5,473 followers
- Fosway (@fosway): 1,561 followers
In total we analysed 24,164 Twitter unique profiles (as some may be following two or more influencers). Total tweets analysed: around 3M.
For our methodology and the full 2016 report please visit L&D trends on Twitter in 2016.