Have you ever caught yourself staring at beautiful charts or cascades of numbers that doesn’t actually tell you anything – at least nothing you need to know?

Like machine learning or artificial intelligence – nowhere near perfect but still extremely useful in certain scenarios. As learning professionals we should be committed to delivering satisfaction to our people and value for our organisation.
Prior to our entrance into workplace learning, we obsessed about daily and monthly active users, churn and retention, customer value and the like. Where we came from (social gaming and e-commerce), measuring efficiencies and behaviours in order to improve your offerings is in everyone’s survival toolkit.
Although well trained in all matters UX and analytics, we were clueless (and exposed) when engaging with L&D. One of our early L&D mentors, Abi (Bracken) Todd from Telefónica O2, quickly realised we were in dire need of an L&D cheat sheet so that we could effectively communicate what we actually do to the very people we were trying to help.
Demand for ROI certainly existed. All the business leaders who engaged with us wanted to deliver measurable value, quickly. We needed to develop a structure to help L&D translate the results of their work into the ROI terms business leaders favor. And thus, in 2014, the ACME analytics framework was born.
Managing your learning portfolio
As important as ROI is, simplicity is more so. The manager and content creator are as dependent on a clean interface and great UX as the learner. And that’s why their workspace needs to be as compelling as the end user’s learning experience.

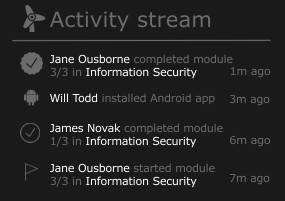
Our dashboard includes a real-time activity stream, so you can follow the up-to-the-minute heartbeat of your learning campaigns.

Fortunately the rise of xAPI and the LRS (Learning Record Stores) has made it clear that analytics are no longer something to be kept locked away in the company basement. Still, building a compelling business case using your data remains virtually uncharted territory for L&D.


