Four ways JollyDeck has addressed the issue of bad data in L&D

It’s no secret that data has never been L&D’s forte. It’s unstructured, pulled from many different sources and many times missing context. Most people that we speak to have gotten used to it. That’s simply the state of play.
It shouldn’t be this way.
That’s why we came up with four ways in which we are helping our clients to get a holistic view of their learning performance, all through the eyes of data.
1. Real data, in real time
First and foremost – you need to be able to see what is happening when it is happening.
A spreadsheet in your inbox once a week simply won’t cut it if you want to help the business drive decisions with through learning data.
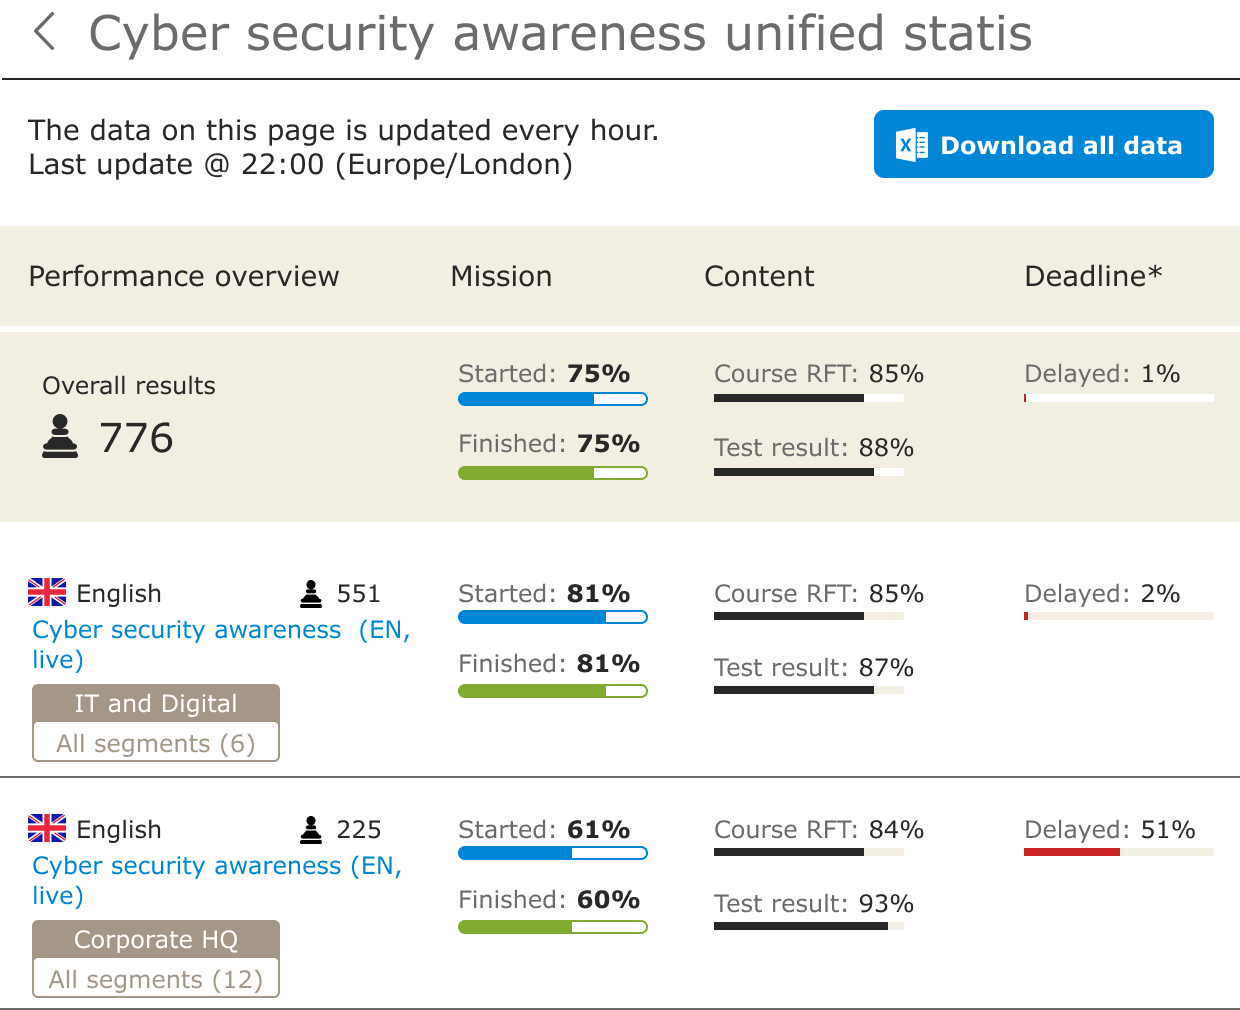
All data collected by JollyDeck is available in real time.
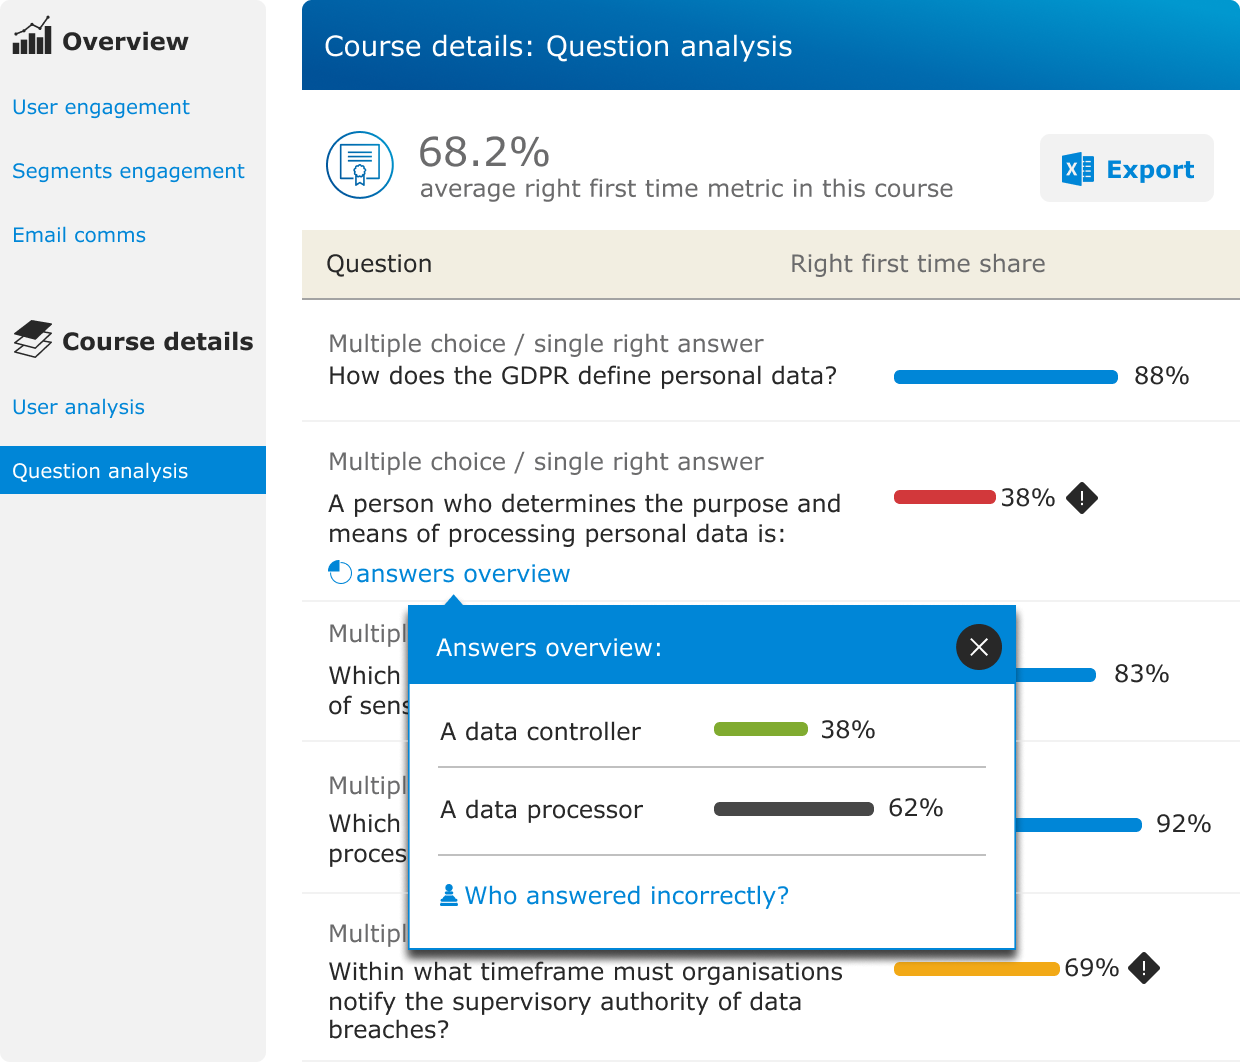
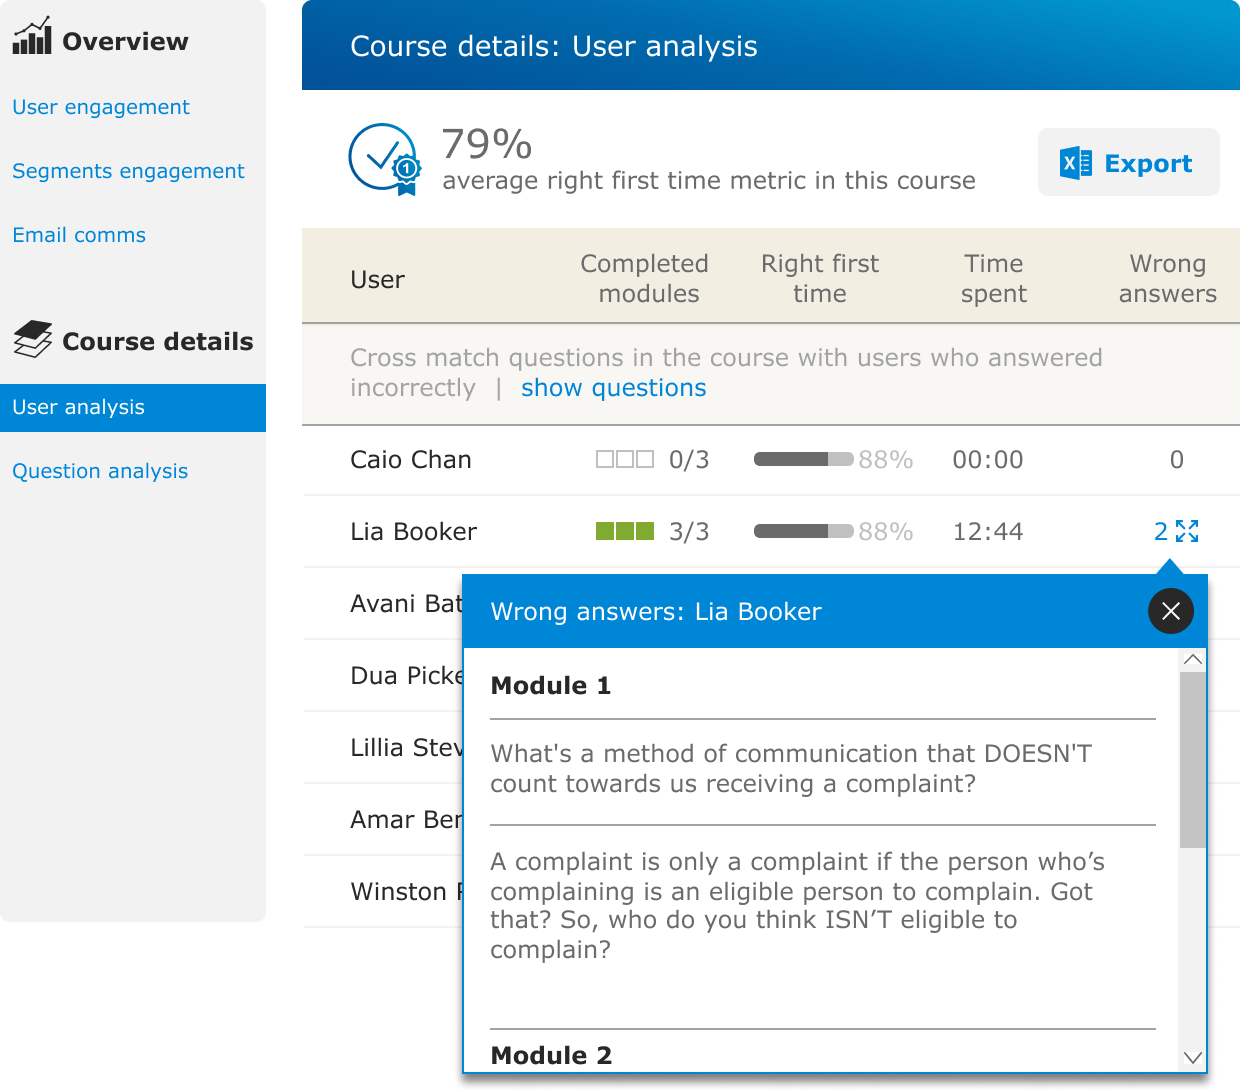
You see how long it’s taking your learners to answer particular questions, what they’re struggling with and what simply isn’t working. So you can spend less time questioning and more time doing.
2. Recording all touchpoint data
When it comes to the learners, it’s important to know what makes them tick. JollyDeck records when a learner logs in, completes a course, gets a question wrong, the time they spend interacting with any content element, and pretty much anything you could possibly need – now or in the future.
Not only is it simply put on record, but those touchpoints are classified and organised. Meaning our clients can easily build their reporting functions.
3. We’ve sorted out data sorting
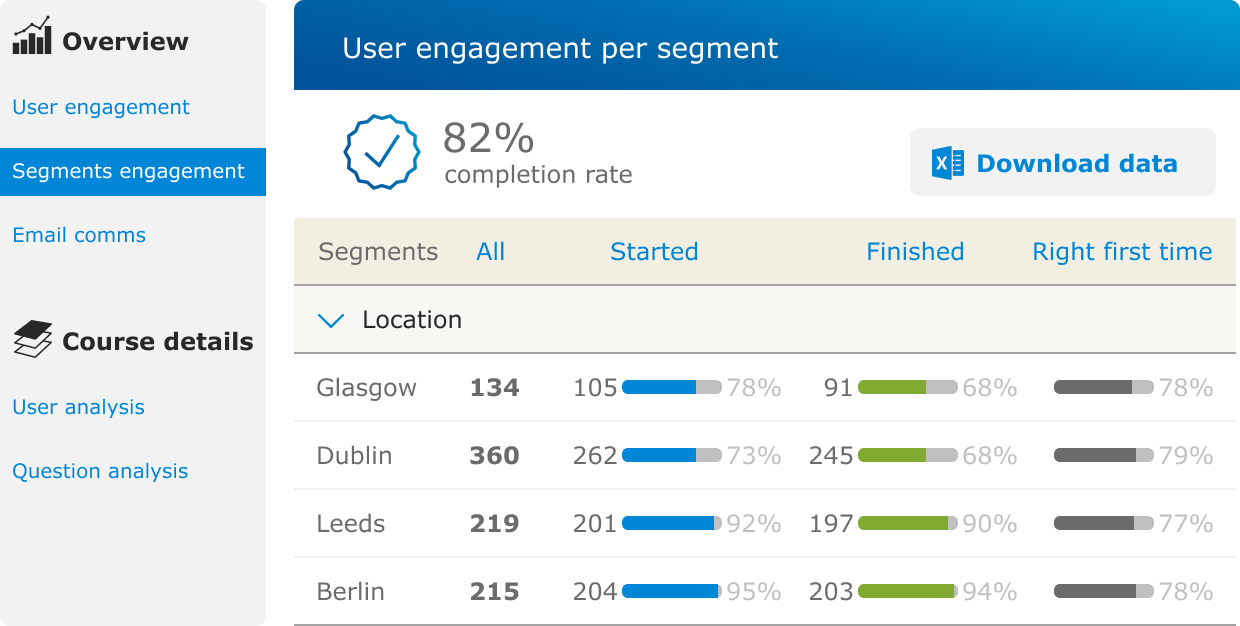
Once you’ve collected all your data – we doubt you’re just going to let it sit there. That’s why JollyDeck allows you to dive into the outreaches of what your learners are up to. Want to know what question all your learners found the hardest? Of course you do. Want to know how your Glasgow office is performing compared to your Berlin office on completion rates? Whyever not.
Get stuck in.
4. Data straight from the horses’ mouth
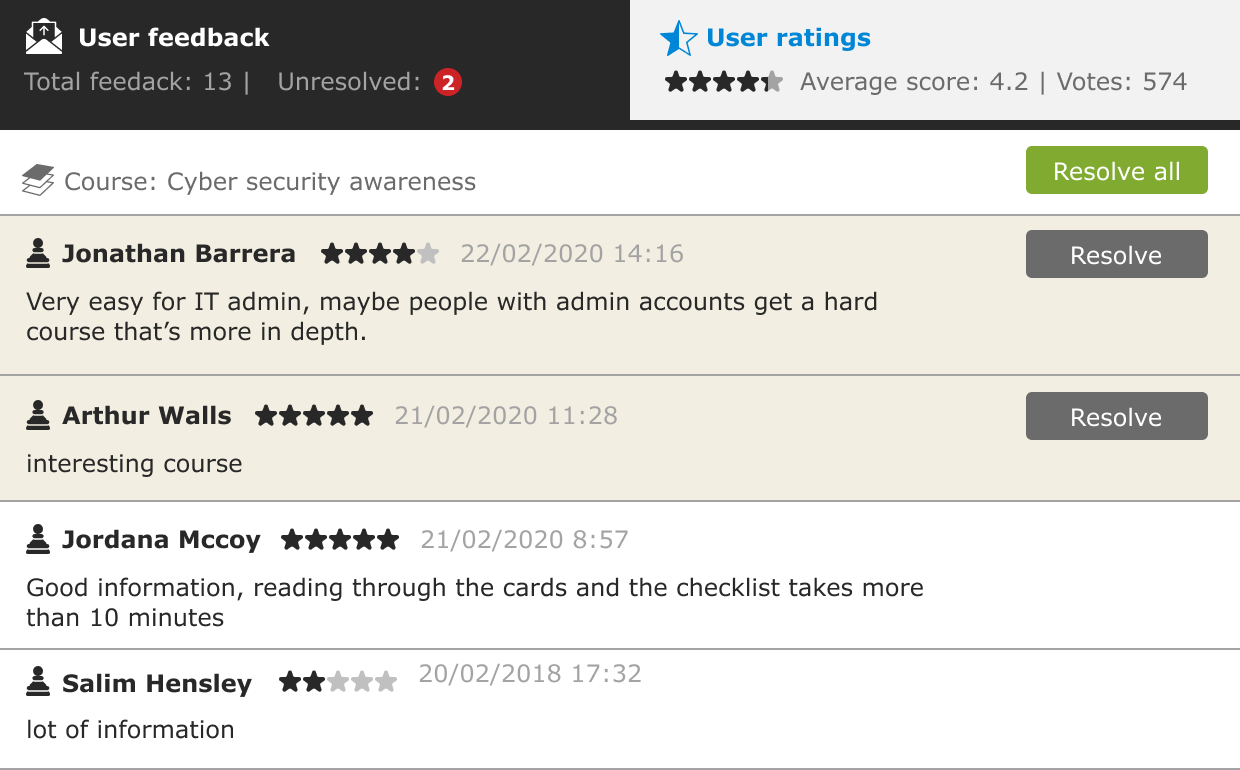
One feature we’re most proud of is our ratings and feedback capabilities. Learner’s can comment on content as they go, providing feedback, ratings and insights. You can see learner feedback as soon as a course is launched, and receive real-time notifications about new activity if you choose to do so.
Do you have to agree with everyone? Absolutely not.
Does a little feedback help? We’ll let you be the judge…
In the meantime we invite you to have a quick look at the short video presentation of our analytics module. Or why not request a demo access to play with the data yourself?
