9 KPIs to track for meaningful insights into compliance training


KPIs (or Key Performance Indicators) are a great way to get an indicator if your compliance training is on the right track to achieving your goals. KPIs can be directly related to training (e.g. completion rates), or they can focus on how the training is affecting your business. For example, they might assess how many data breaches have occurred after training on information security has been run.
This article will focus on KPIs that directly relate to your compliance training program, meaning that you should be able to track them in any modern LMS for compliance training.
We have already outlined what the crucial KPIs are in our guide to compliance training, so now it’s time to discover how they can be utilised to improve the efficiency of your training.
KPIs of compliance training
Completion rates
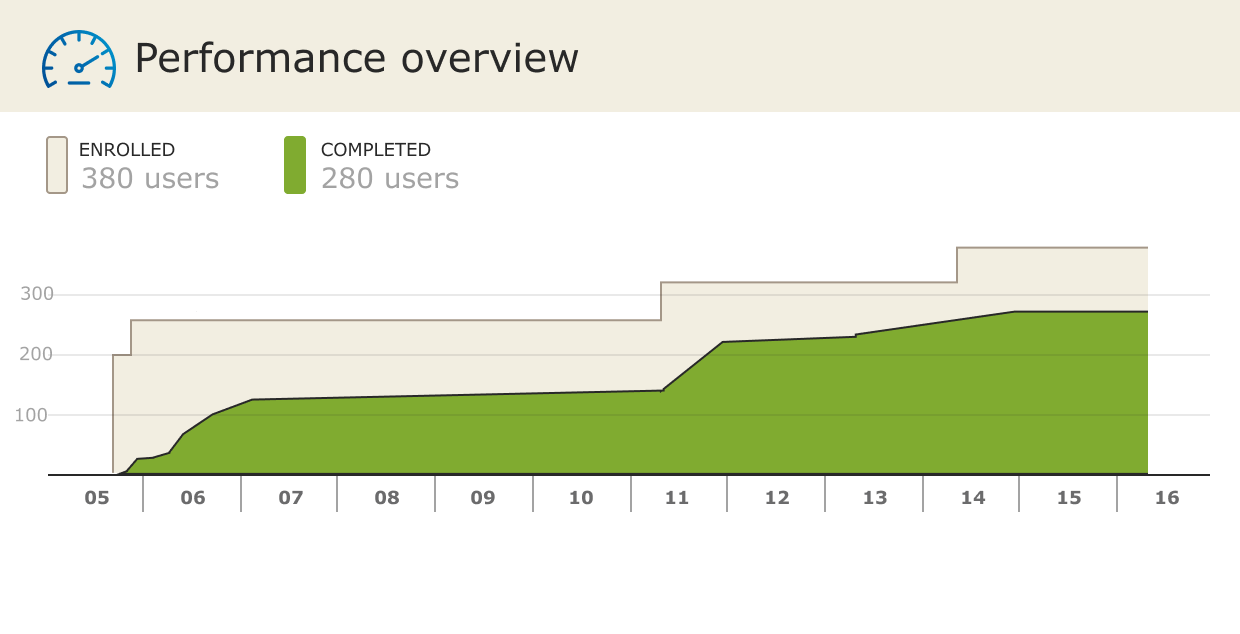
Completion rates are the most straightforward and commonly used KPIs in compliance training. They provide a quick overview of the training progress and are essential for any audit trails that your company undergoes.
Because compliance training is mandatory, the goal of this KPI is to be as close to 100% as possible. This is often easier said than done though, as there is a large number of people to manage in making sure this KPI is reached.
What this KPI doesn’t provide however is adequate information into the actual learning experience and how well the knowledge was retained.
Drop-out rates
Before you begin to measure the completion rates, you should realise that you will never have a 100% completion rate. When you complete a further break-down of those who haven’t completed the training yet, you will be able to identify friction points in the training content or user experience.
The main two reasons for low completion rates, however, are as follows:
-
The learner never started the training.
There are many reasons why this could be. Typically, these are due to factors like access issues, inefficient training communications (e.g. the user is unaware of the initiative, emails were not delivered or ended in spam), and database anomalies (e.g. duplicates accounts, long term absence or people have left the company.)
-
They started the training but never finished.
If this is the situation, look as to where you are losing most of your audience. There may be a particular point in the training or content piece where significantly more learners usually drop out.
Whether it’s a matter of technical barriers, outdated employee data or unattractive content, you need to react and address these issues accordingly.
Assessment results
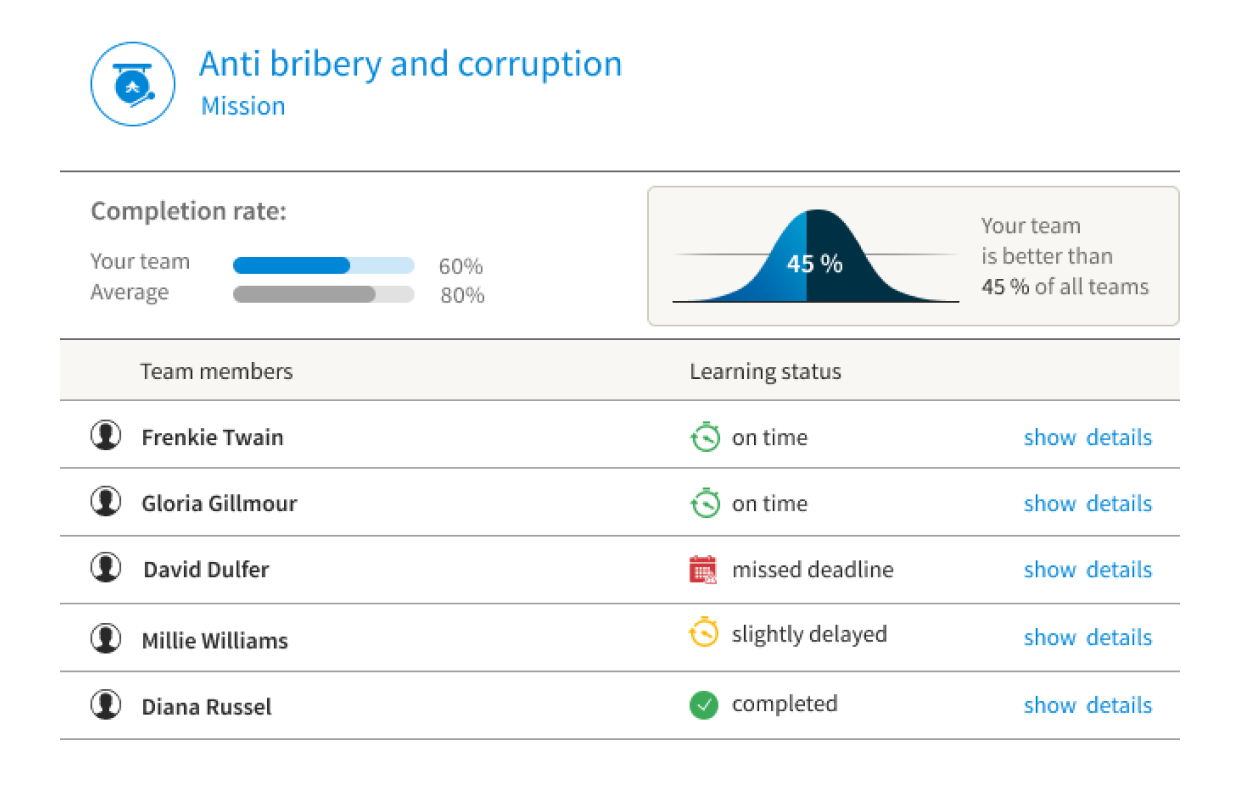
Assessment results are the most common way to evaluate your employees’ learning performance. This can be monitored by metrics like the pass/fail rate, the average test score, how many attempts were needed to get the right result, and how many employees achieved the right-first-time answer.
The assessment results reflect on the efficiency of the learning part of the training, directly showing how successfully the information was delivered to the learners and if the key messages were received.
This KPI also indicates any abnormalities within the training. For example, if there is a sudden and unexpected drop in the average test scores, it may be due to a change in how the training is being delivered. Factors like having a new supervisor giving different guidelines to employees, or the guidelines from the training are no longer relevant in a newly introduced workplace procedure then these will directly impact the training results.
Depending on how deep you want to dive into the data, the assessment results will tell you as much as you want to know. However, there are some indicators of bigger issues that, if not properly addressed, can be misleading.
This may be something like having results that are too good across the board. On the one hand, this may be that you’re running extremely efficient training, but on the other, it could be a sign that your questions are too easy.
Similarly, if the results of your training are too negative, it may be that your training is inadequate, or that the questions are too hard.
Knowledge gaps
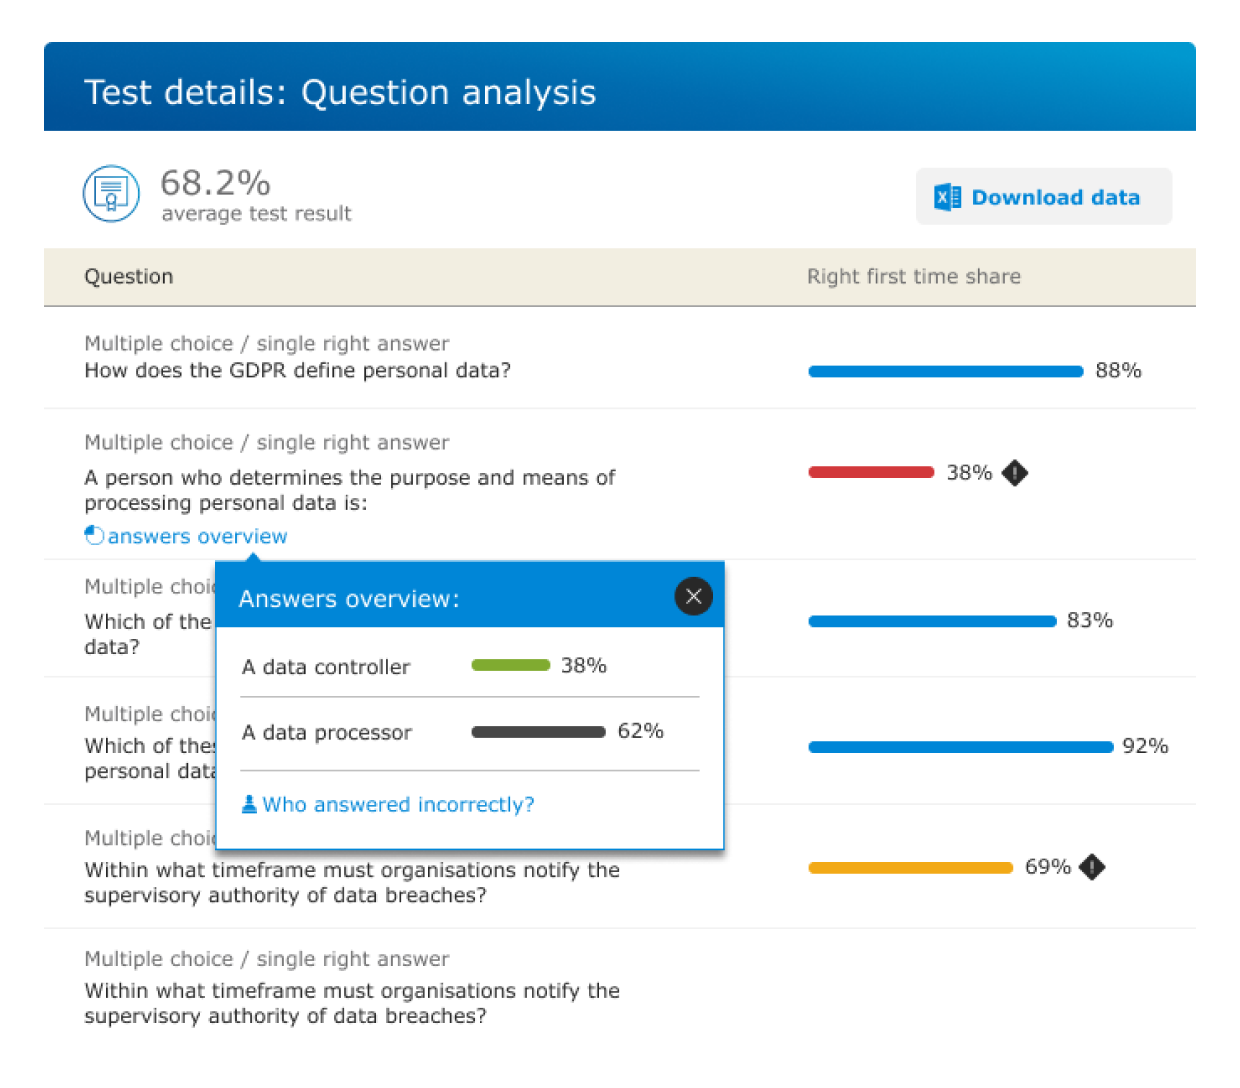
The best way to identify knowledge gaps is to run an assessment with questions that cover all of the relevant topics. This is essential in order to improve the training for future generations as you will be able to see if there are questions that have been largely answered incorrectly. It may be that with these knowledge gaps, the topic wasn’t explained clearly enough in the training or the questions were poorly written.
In this case, it is worth looking at how other questions relating to this topic were answered. If there is again a disproportionate amount of people getting these answers wrong, it’s probably due to insufficient training. If the other questions around this topic were mostly answered correctly, then it probably means that the question was worded strangely.
You may also find that different segments within your organisation respond differently. For example, HR might have struggled with a topic in an Information Security course, but IT is scoring above average on it. This would be a good indicator that specialist courses or support materials are needed. For those who have no preexisting knowledge of the course, it allows the information to be explained simply and ensures that everyone is up to speed.
Best performing segments
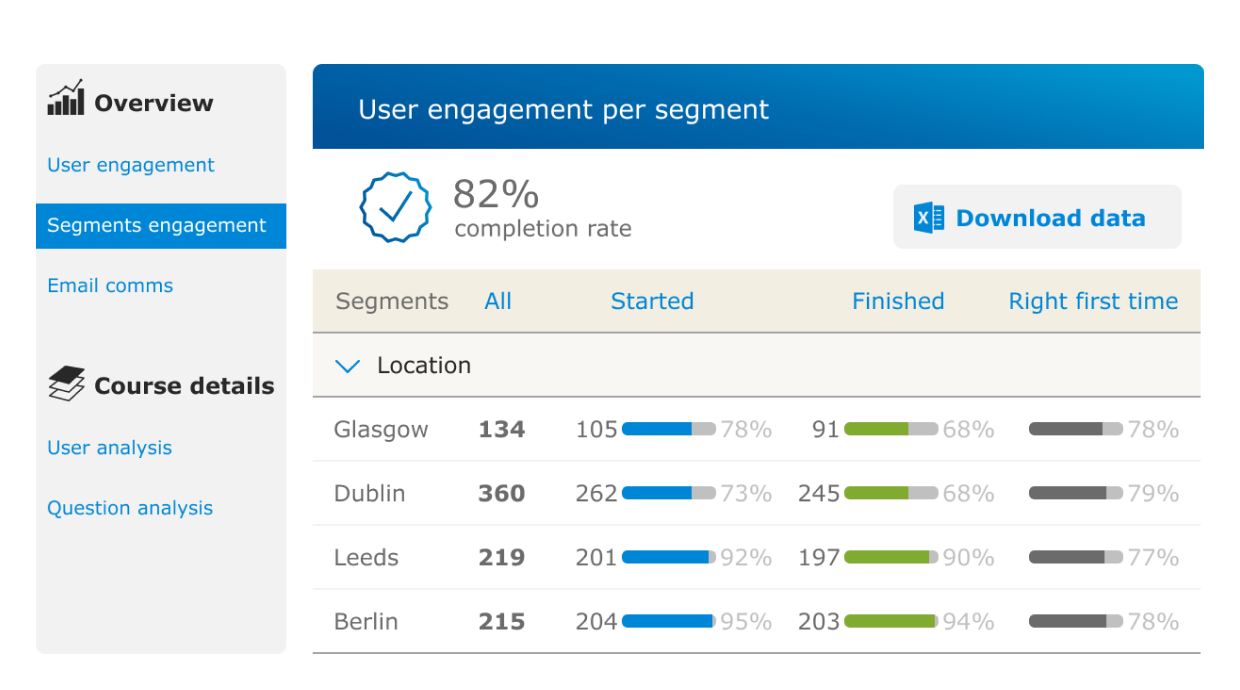
If you are using an LMS with well structured and organised advanced analytics, you can easily compare the progress of your compliance training across different segments (e.g. at different offices, locations or departments). This will allow you to see if there are segments that have any anomalies in their completion rates or test scores.
There are a variety of reasons as to why these anomalies exist. It may be that one area is facing technical difficulties, one department having a higher preexisting knowledge base due to their job function, or maybe even certain managers put more or less of an emphasis on training than others.
To get to the bottom of these anomalies, it is likely that you’ll need to investigate the situation in the field and by talking to people directly.
Best performing content
User metrics are not the only KPIs that need to be considered, however. You also need to look closely at the metrics that are provided by the training content. The best performing content can be recognised by the number of views, average views per learner or the learners’ ratings. If there are certain pieces that score extremely highly in these metrics, check what do they have in common. For example, is one topic more favourable than others? Is one format preferred over other training formats you’ve run? Or was the copy and instruction design more enticing than it has been in previous courses?
It’s worth looking at all the factors involved, as these approaches can be adopted when designing future learning materials or when you are looking to buy your next piece of off-the-shelf training.
If certain formats like guides, checklists, video tutorials and infographics are doing extremely well, then you might want to consider offering more of these in the future.
Satisfaction feedback
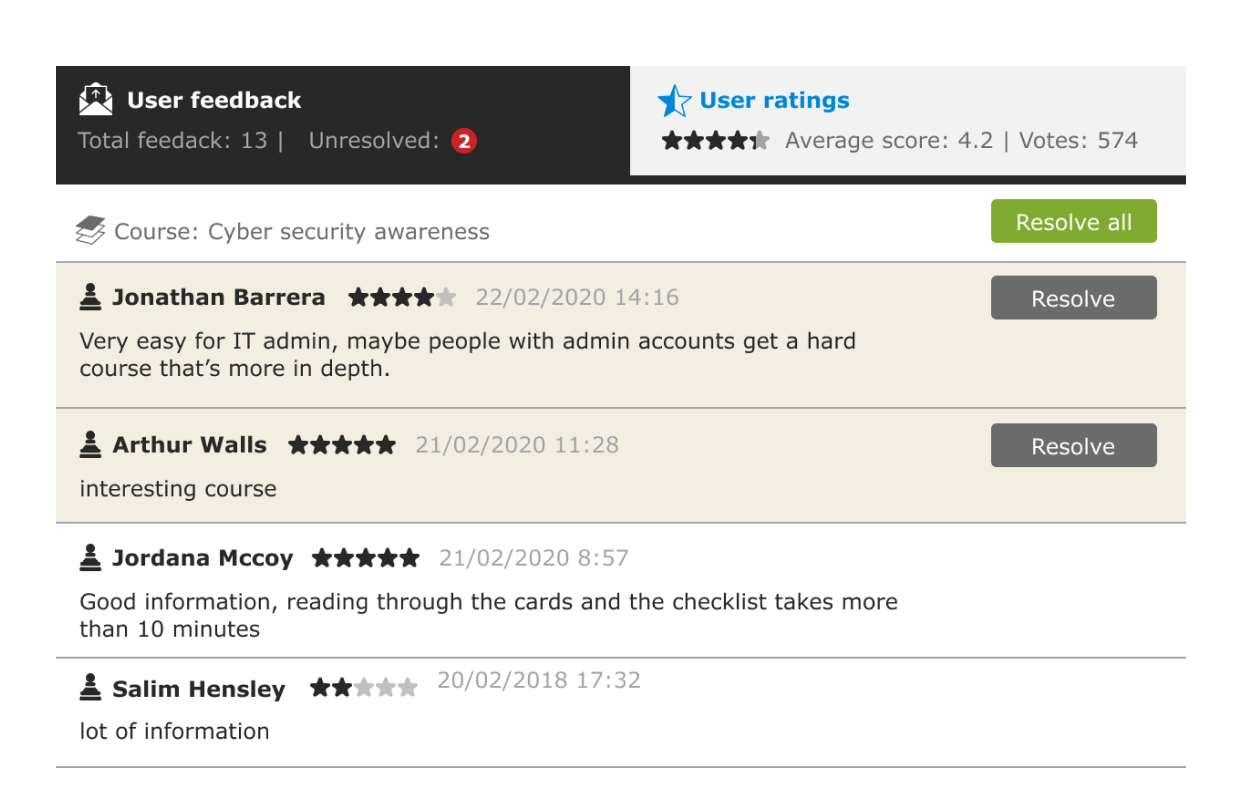
Collecting your learner’s feedback gives you first-hand information on how the training can be improved in the short-term. However, for the best results, you should be tracking the user sentiment on a longer-term basis. This will enable you to see insights into any increase or decrease of the user satisfaction level with each iteration of the training.
Devices used
Looking at how your learners are physically accessing your training will give you a great insight into their learning experience. It may be that you expected your content to mainly be used on mobile devices, yet most users are accessing it via desktop. If your content has been developed primarily for mobile then it will affect how they view the content.
It is therefore essential that you consider the format and design of your e-learning. If necessary, you may even have to realign your content to comply with the most used devices to improve user experience.
Time spent
If you’ve planned your training properly, you’ll likely have an estimate as to how long it will take the learner to complete the training. A key indicator that the learning is too difficult or too time-consuming is if the average time to complete the training is well above what you had anticipated. On the other hand, if the average completion time is much shorter, then the course may not be stimulating enough.
In these situations, it’s worth asking yourself if the training topic is relevant to everyone involved, or if the content is interesting enough or easy enough to understand.
Once you are confident in the relevance and quality of the training content, you should play around with how you can make the training more interactive.
KPIs say the most when combined
At first glance, the KPIs will give you a good insight into how well the training initiative is going. It is only when you connect the dots and look at the KPIs as a collective that you will be able to identify the areas that need to be improved in the training and employees’ knowledge.
The best form of attack when it comes to training is continual development. If you make the right tweaks at the right time, you’ll start seeing higher and higher completion rates and provide a great e-learning experience.
However, in order to truly minimise the risk of incidents within the organisation, you should be running compliance training that is both efficient and successful.
By measuring the described KPIs of your compliance training and keeping a track record of its effectiveness in the workplace after its completion, you’ll be able to properly evaluate the final success of your compliance training.


